Managing Risk
Asset Allocation
Asset allocation helps reduce risk through diversification and is one of the most important decisions an investor can make.
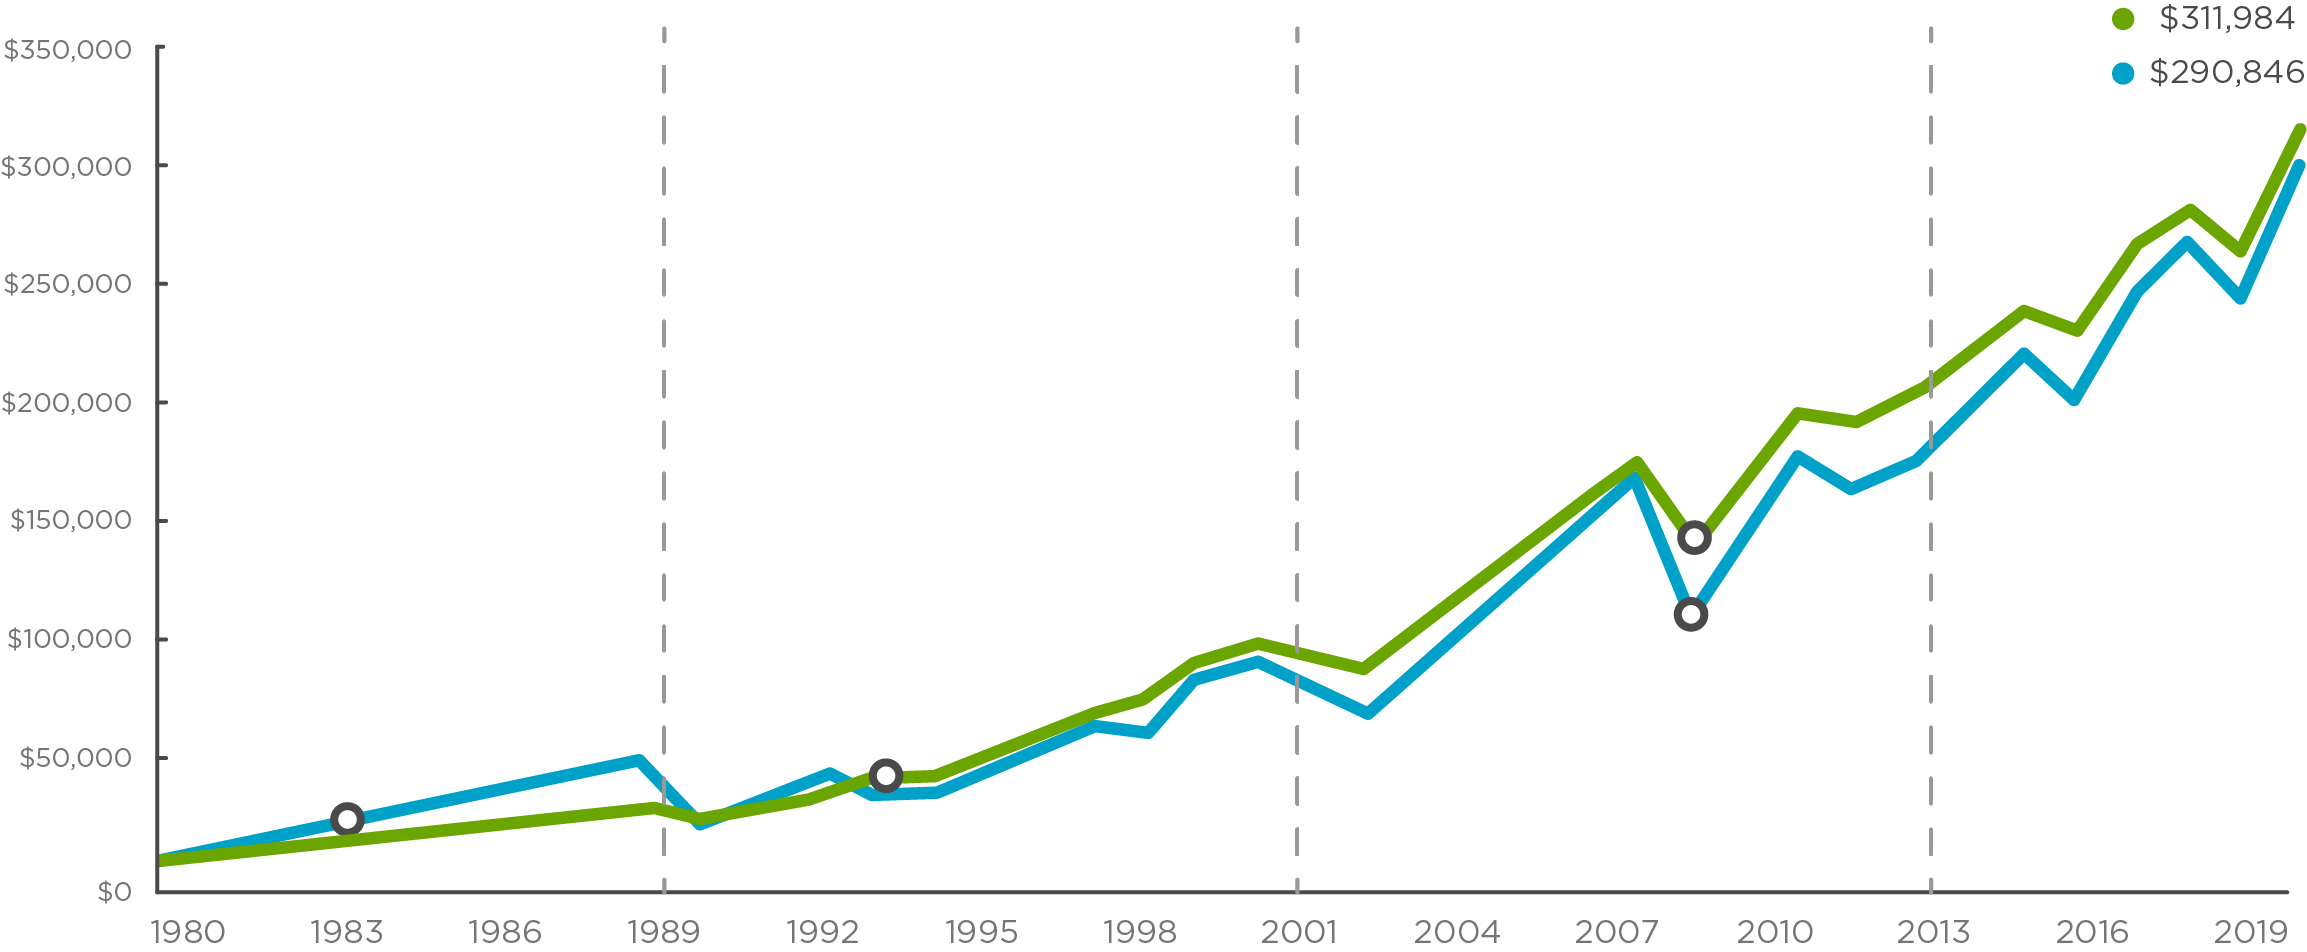
Investment Growth
Asset allocation is a key factor in the risk-return profile of a portfolio. Historically, higher allocations to equities have resulted in higher long-term returns, but with greater levels of short-term volatility.
Best 1 year period
9 years
Best 1 year period
Best 1 year period
Source: Morningstar. For illustrative purposes only. Based on monthly returns in Canadian currency from January 1980 to December 2024. Assumes reinvestment of all income and no transaction costs or taxes. Amounts are rounded to the nearest dollar. Fixed income is represented by the FTSE Canada Universe Bond Index. Equity is represented by equal weight of S&P/TSX Composite Total Return Index and MSCI World Index. It is not possible to invest directly in an index.
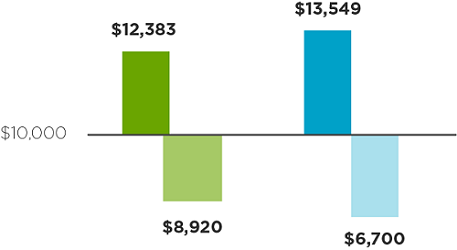
Best and Worst Years
Investing and risk are a package deal. The key to long-term investment success is to manage your exposure to risk by using time and asset allocation to your advantage.
40% Fixed Income / Equities 60%
Equities 100%
Best 1 year period
Sep 2007 - Sep 2008
Source: Morningstar. For illustrative purposes only. Based on monthly returns in Canadian currency from January 1980 to December 2024. Best years reflect the highest annualized returns and worst years reflect the lowest annualized returns based on the indicated rolling period over 44 years from January 1980 to December 2024. The percentage reflects the occurrence of positive returns and negative returns for each asset allocation based on the indicated rolling period over 44 years from January 1980 to December 2024. Assumes reinvestment of all income and no transaction costs or taxes. Amounts are rounded to the nearest dollar. Fixed income is represented by the FTSE Canada Universe Bond Index. Equity is represented by equal weight of S&P/TSX Composite Total Return Index and MSCI World Index. It is not possible to invest directly in an index.
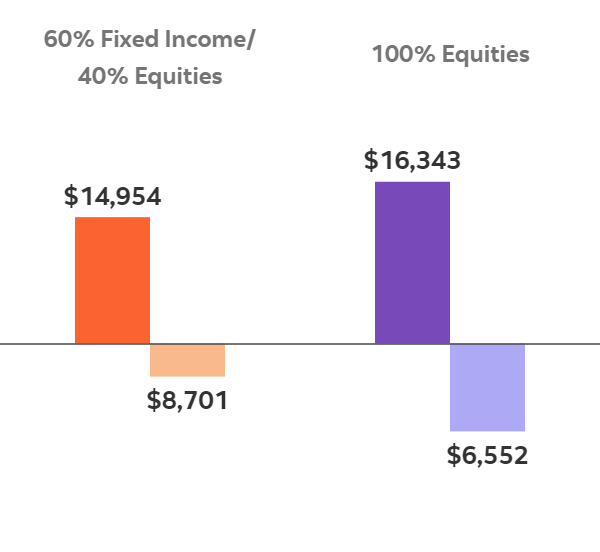
How the portfolio performed
While the performance of a portfolio can vary from one year to the next, the majority of past returns have been positive.
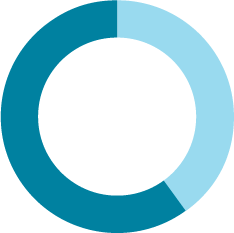
40% Fixed Income / Equities 60%
Positive 1 year returns (50%)
Negative 1 year returns (50%)
Equities 100%
Positive 1 year returns (50%)
Negative 1 year returns (50%)
Source: Morningstar. For illustrative purposes only. Based on monthly returns in Canadian currency from January 1980 to December 2024. Best years reflect the highest annualized returns and worst years reflect the lowest annualized returns based on the indicated rolling period over 44 years from January 1980 to December 2024. The percentage reflects the occurrence of positive returns and negative returns for each asset allocation based on the indicated rolling period over 44 years from January 1980 to December 2024. Assumes reinvestment of all income and no transaction costs or taxes. Amounts are rounded to the nearest dollar. Fixed income is represented by the FTSE Canada Universe Bond Index. Equity is represented by equal weight of S&P/TSX Composite Total Return Index and MSCI World Index. It is not possible to invest directly in an index.
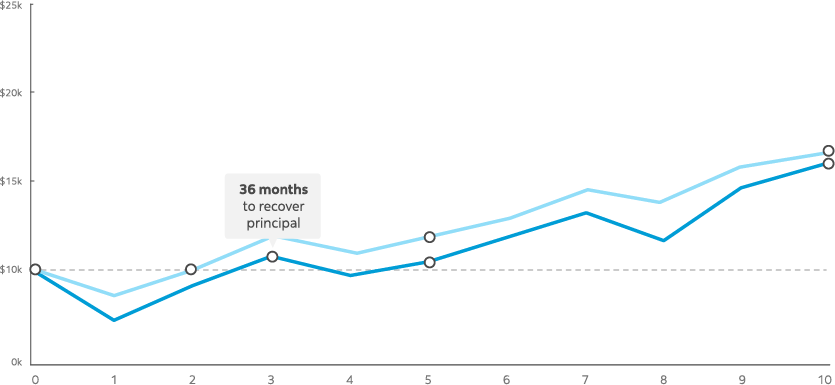
Time to Recover
The longer you hold an investment, the smaller the impact a market downturn has on your total return. This chart uses historical data to show the average 3-month downturn of each asset allocation between 1980 and 2024, the time it took to recover and the value of the portfolios 1, 3 and 5 years after the downturn.
3 months
3 months
3 months
Source: Morningstar. For illustrative purposes only. Based on monthly returns in Canadian currency from January 1980 to December 2024. Starting downturn reflects the average of negative rolling 3-month returns for the indicated asset allocation. Time to recover reflects the amount of months taken, on average, to recover the original investment amount following the average 3 month downturn. Investment amounts after 1, 3, and 5 years are based on the cumulative average return for each respective period following the average 3-month downturn. The illustration is hypothetical and does not reflect actual results or the returns or future value of an actual investment. Assumes reinvestment of all income and no transaction costs or taxes. Amounts are rounded to the nearest dollar. Fixed income is represented by the FTSE Canada Short Term Bond Index. Equity is represented by equal weight of S&P/TSX Composite Total Return Index and MSCI World Index. It is not possible to invest directly in an index.