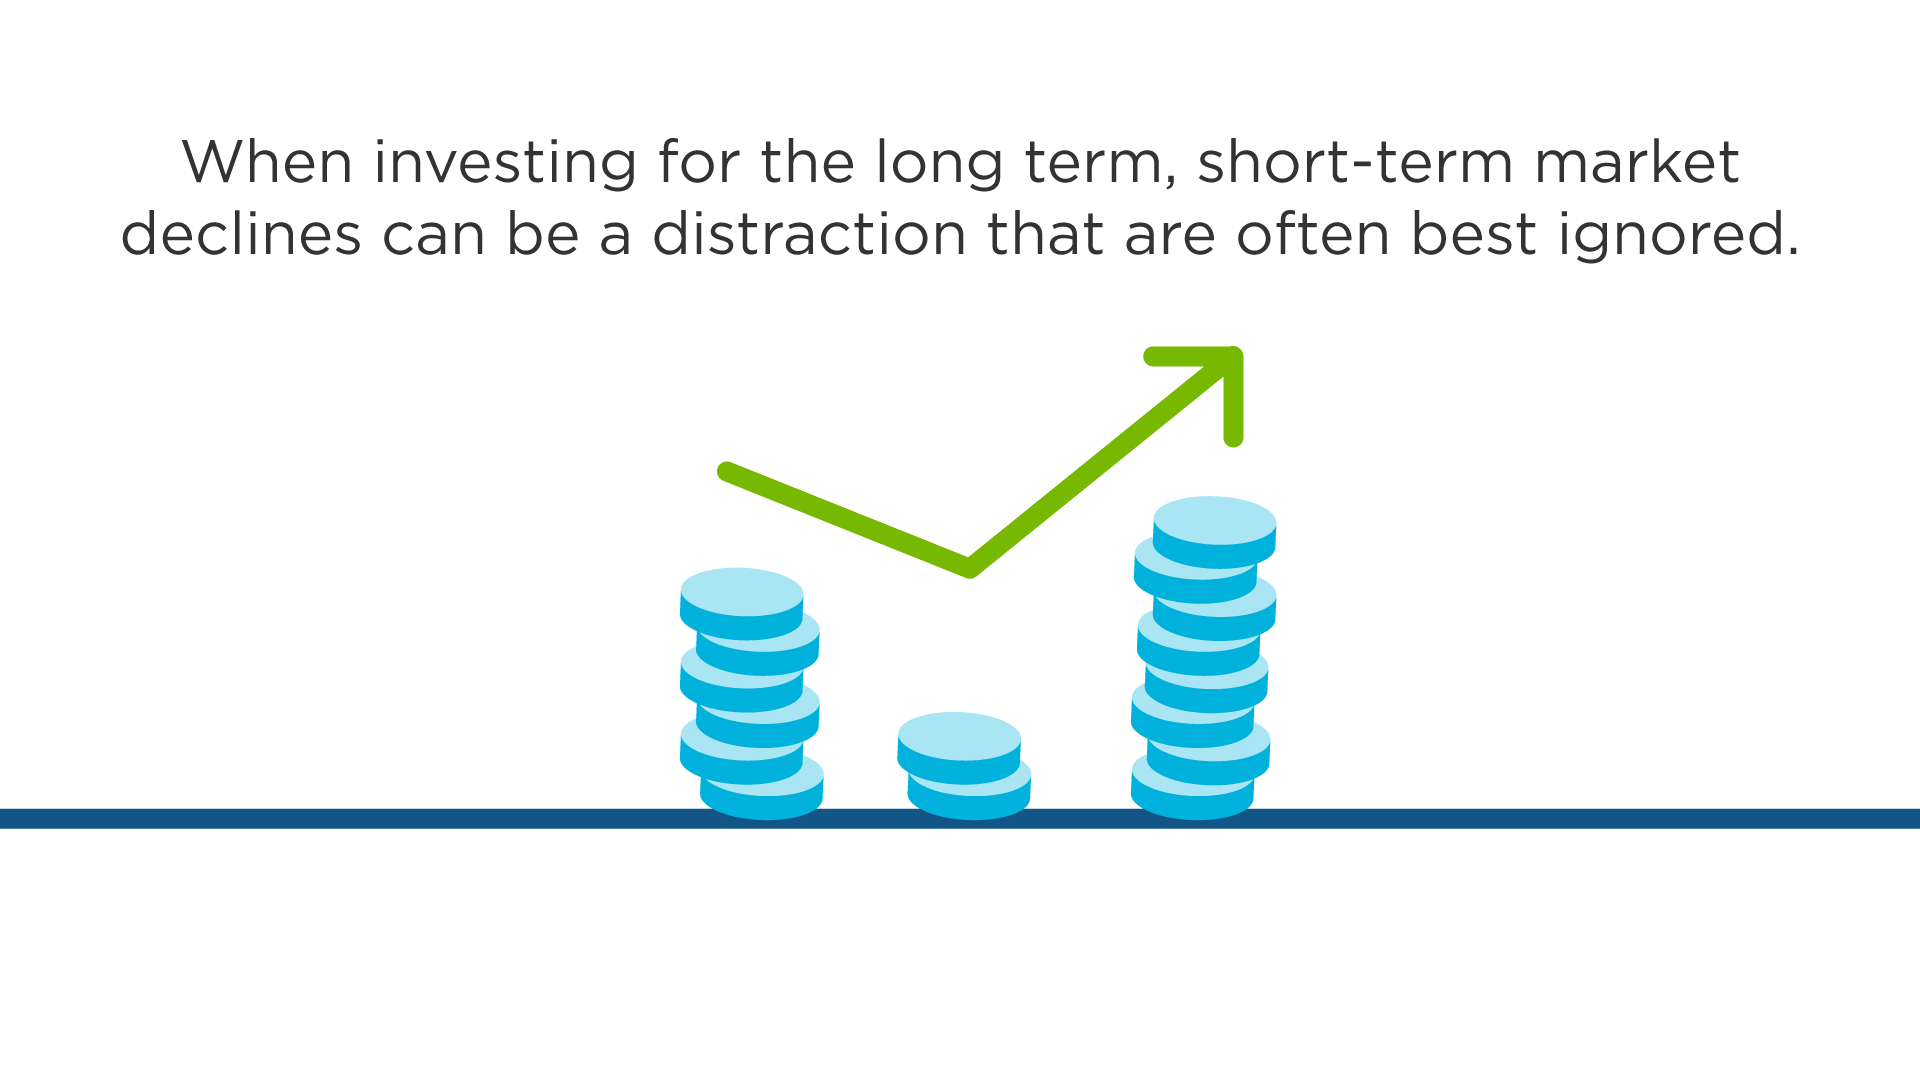
Sequence of Returns
The sequence of returns you experience when drawing an income from your savings can have a significant impact on your investment. A diversified investment approach and a financial plan that incorporates your cash flow needs in retirement can help manage sequence of returns risk.
Please enter a value between $0 and $1,000,000.
Please enter a value between $0 and $100,000.
Complete the fields to see the impact of sequence of returns
| Year | Current | Year 1 | Year 2 | Year 3 | Year 4 | Year 5 | Year 6 | Year 7 | Year 8 | Year 9 | Year 10 |
|---|---|---|---|---|---|---|---|---|---|---|---|
|
Good Start
|
Current $0
|
Year 1 $0
|
Year 2 $0
|
Year 3 $0
|
Year 4 $0
|
Year 5 $0
|
Year 6 $0
|
Year 7 $0
|
Year 8 $0
|
Year 9 $0
|
Year 10 $0
|
|
Stable Return
|
Current $0
|
Year 1 $0
|
Year 2 $0
|
Year 3 $0
|
Year 4 $0
|
Year 5 $0
|
Year 6 $0
|
Year 7 $0
|
Year 8 $0
|
Year 9 $0
|
Year 10 $0
|
|
Bad Start
|
Current $0
|
Year 1 $0
|
Year 2 $0
|
Year 3 $0
|
Year 4 $0
|
Year 5 $0
|
Year 6 $0
|
Year 7 $0
|
Year 8 $0
|
Year 9 $0
|
Year 10 $0
|
$48,581
Good start, stable return, or bad start |
Year 1 | Year 2 | Year 3 | Year 4 | Year 5 | Year 6 | Year 7 | Year 8 | Year 9 | Year 10 | Annualized |
|---|---|---|---|---|---|---|---|---|---|---|---|
| Good Start |
24.0%
|
16.0%
|
4.0%
|
-5.0%
|
11.0%
|
9.0%
|
10.0%
|
7.0%
|
-6.0%
|
-16.0%
|
4.8%
|
| Stable Return |
4.8%
|
4.8%
|
4.8%
|
4.8%
|
4.8%
|
4.8%
|
4.8%
|
4.8%
|
4.8%
|
4.8%
|
4.8%
|
| Bad Start |
-16.0%
|
-6.0%
|
7.0%
|
10.0%
|
9.0%
|
11.0%
|
-5.0%
|
4.0%
|
16.0%
|
24.0%
|
4.8%
|
 Good Start
 Stable Return
 Bad Start
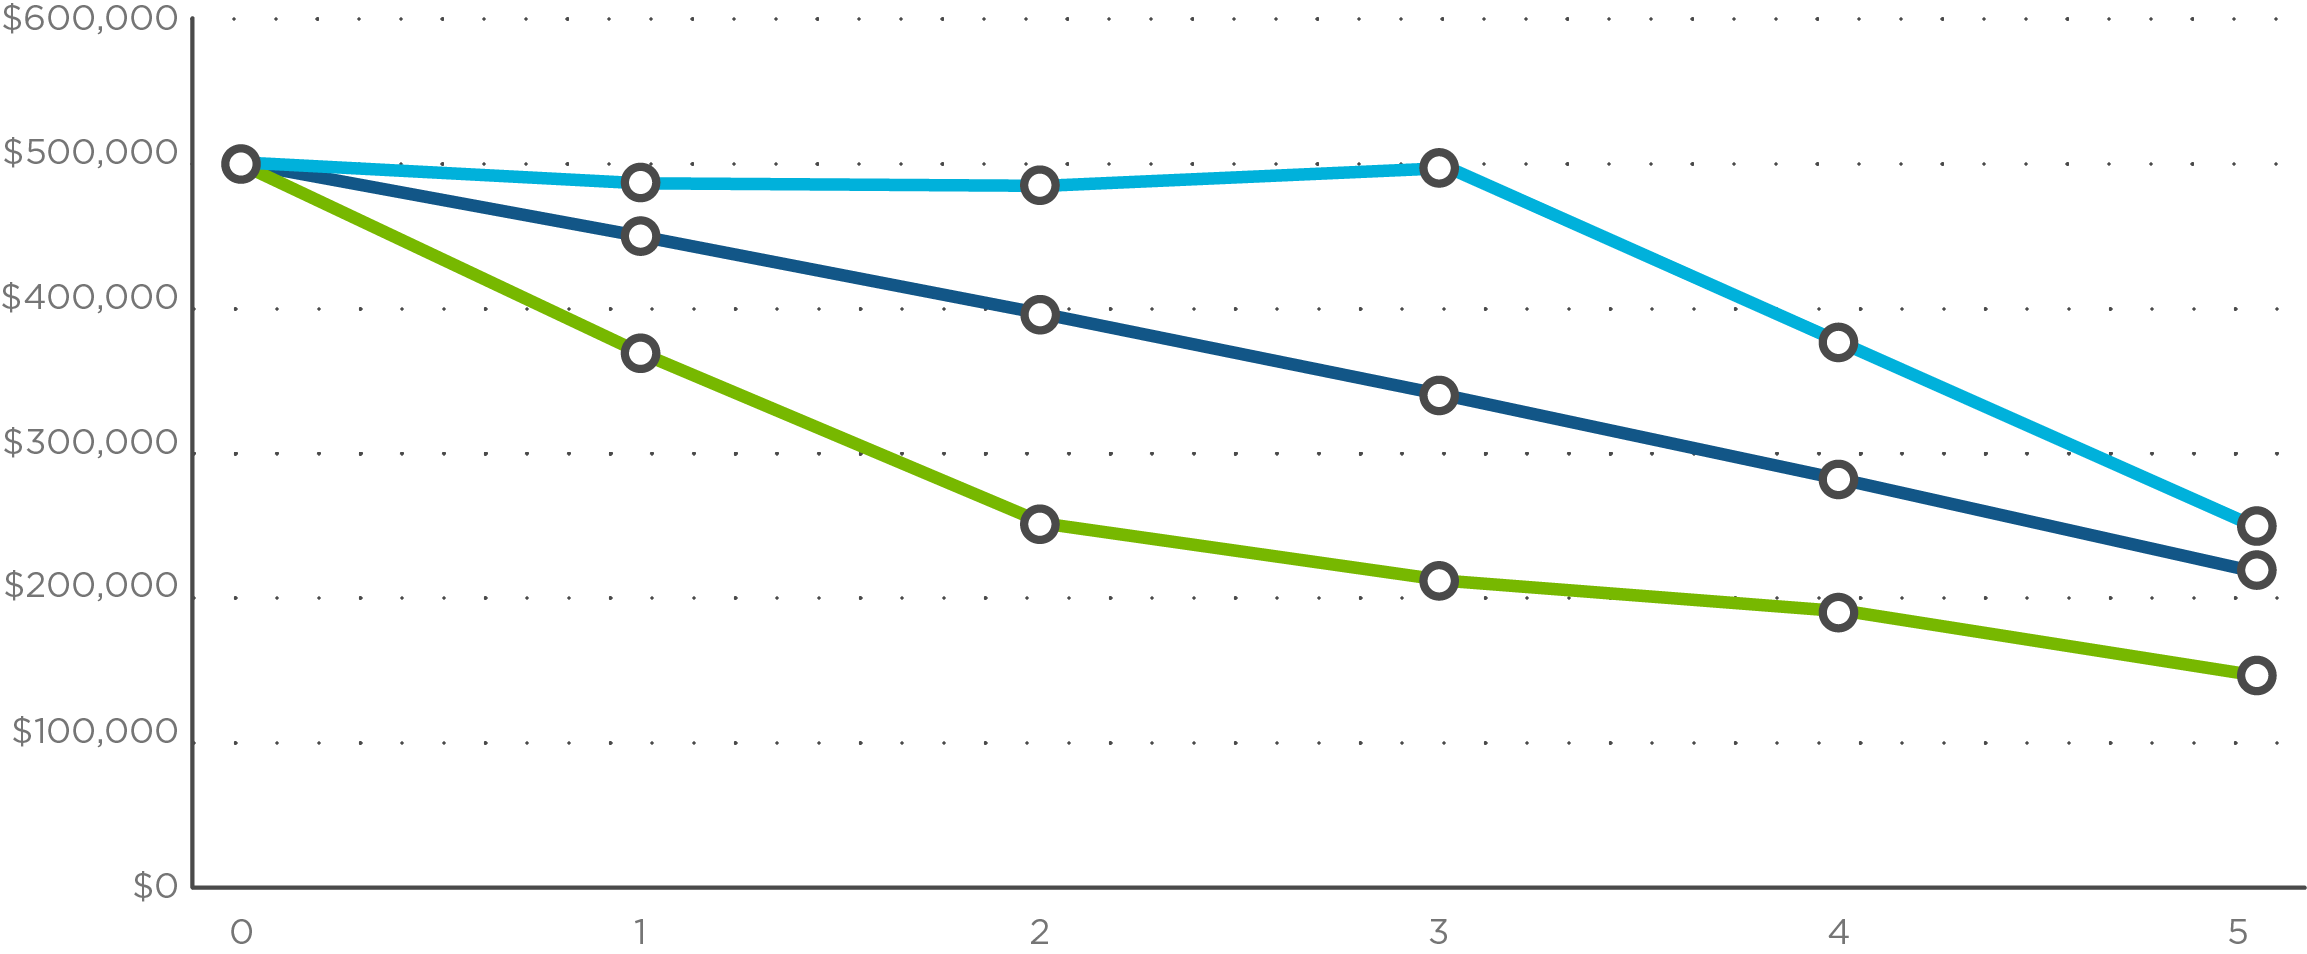
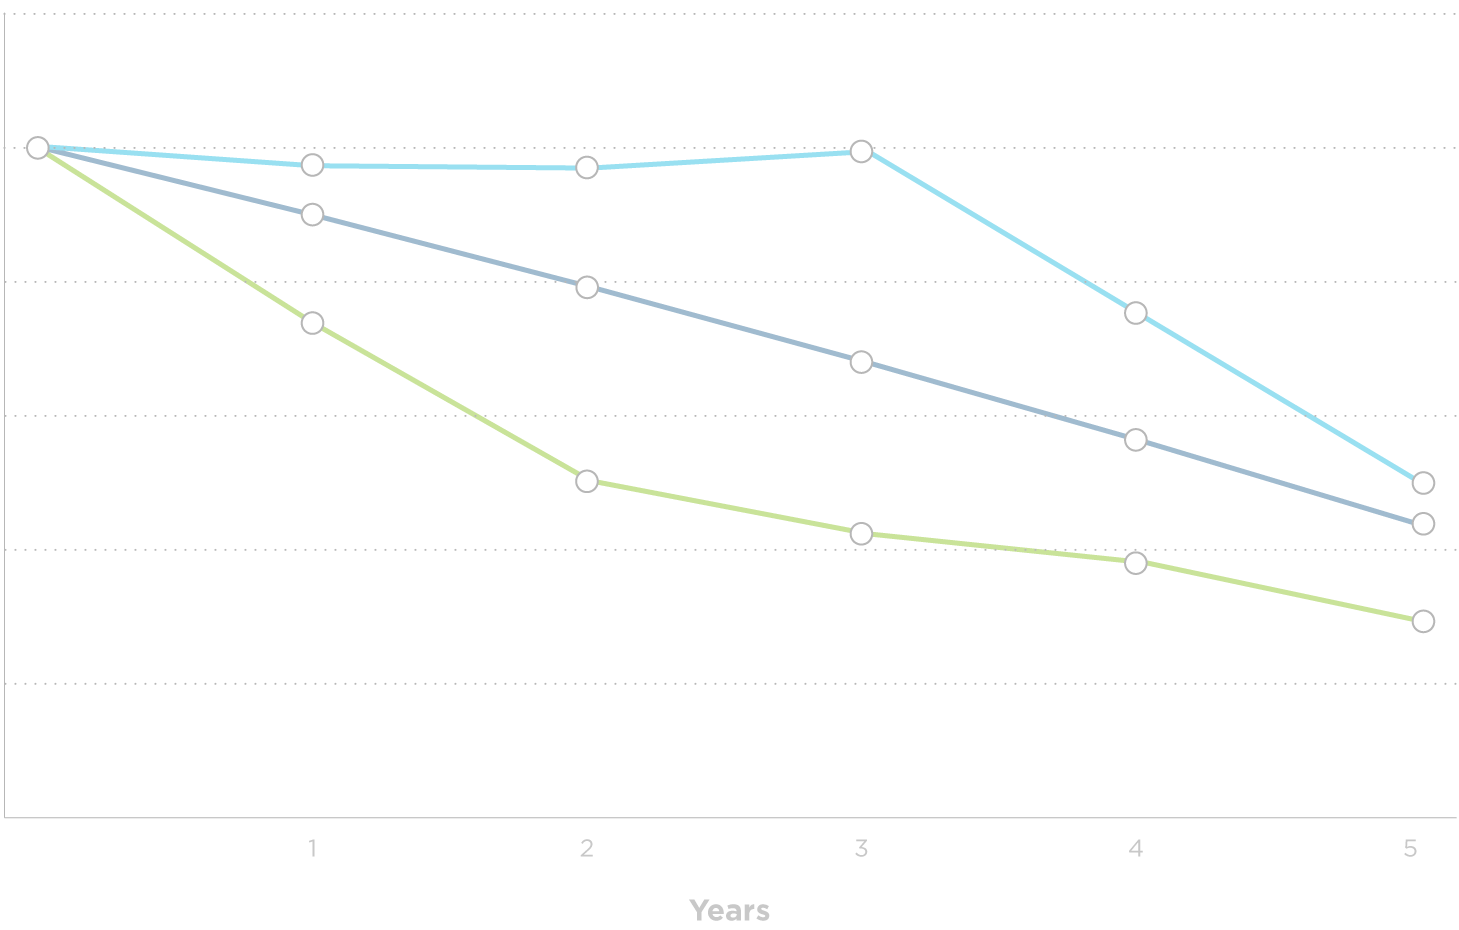
| Year | Good Start | Stable Return | Bad Start |
|---|---|---|---|
Year 1 |
24.0%
|
4.8%
|
-16.0%
|
Year 2 |
16.0%
|
4.8%
|
-6.0%
|
Year 3 |
4.0%
|
4.8%
|
7.0%
|
Year 4 |
-5.0%
|
4.8%
|
10.0%
|
Year 5 |
11.0%
|
4.8%
|
9.0%
|
Year 6 |
9.0%
|
4.8%
|
11.0%
|
Year 7 |
10.0%
|
4.8%
|
-5.0%
|
Year 8 |
7.0%
|
4.8%
|
4.0%
|
Year 9 |
-6.0%
|
4.8%
|
16.0%
|
Year 10 |
-16.0%
|
4.8%
|
24.0%
|
| Annualized |
4.8%
|
4.8%
|
4.8%
|
For illustrative purposes only. The example uses a hypothetical sequence of returns for various scenarios using the rates indicated in the table above. Each scenario experiences the same hypothetical annualized 4.8% rate of return over a 10-year period. Assumes reinvestment of all income, and does not include transaction costs, fees, or taxes. The example does not reflect actual results or the returns, cashflow or future value of an actual investment.
Sequence of Returns Video
Sequence of returns can have a significant impact on your investment when drawing an income from your savings.