
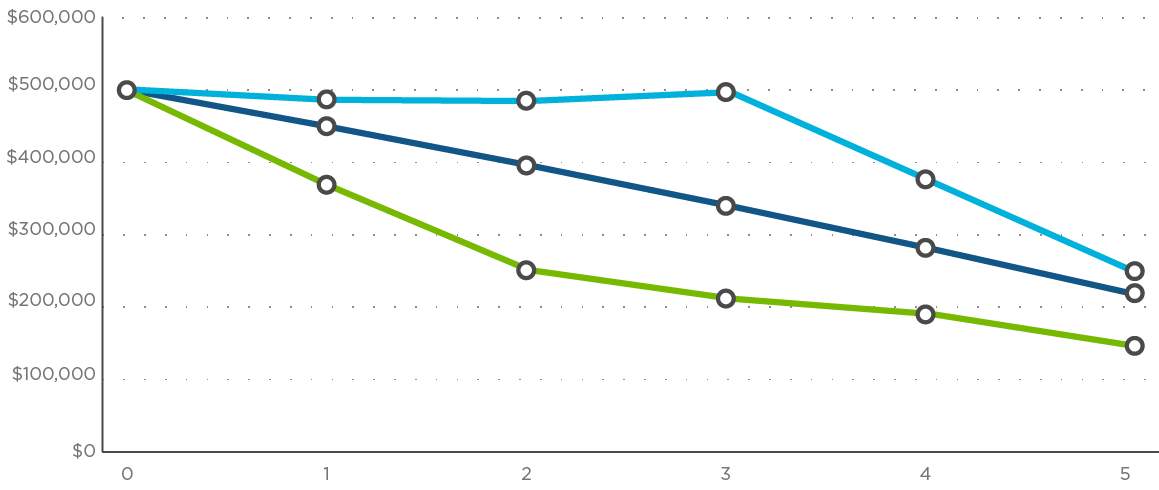
Sequence of Returns
Sequence of returns can have a significant impact on your investment when drawing an income from your savings.
Your Inputs
Total retirement savings:
$1,000
Withdrawal amount:
$25
Withdrawal frequency:
Quarterly
 Good start
 Stable return
 Bad start
| Year 1 | Year 2 | Year 3 | Year 4 | Year 5 | Year 6 | Year 7 | Year 8 | Year 9 | Year 10 | Annualized | |
| 24.0% | 16.0% | 4.0% | -5.0% | 11.0% | 9.0% | 10.0% | 7.0% | -6.0% | -16.0% | 4.8% | |
| 4.8% | 4.8% | 4.8% | 4.8% | 4.8% | 4.8% | 4.8% | 4.8% | 4.8% | 4.8% | 4.8% | |
| -16.0% | -6.0% | 7.0% | 10.0% | 9.0% | 11.0% | -5.0% | 4.0% | 16.0% | 24.0% | 4.8% |

Dynamic Funds® is a registered trademark of its owner, used under license, and a division of 1832 Asset Management L.P. For illustrative purposes only. The example uses a hypothetical sequence of returns for various scenarios using the rates indicated in the table above. Each scenario experiences the same hypothetical annualized 4.80% rate of return over a 10-year period. Assumes reinvestment of all income, and does not include transaction costs, fees, or taxes. The example does not reflect actual results or the returns, cashflow or future value of an actual investment. The information provided is not intended to be investment advice. Investors should consult their own professional advisor for specific investment advice tailored to their needs when planning to implement an investment and/or tax strategy to ensure that individual circumstances are considered properly and action is taken based on the latest available information.
Page 1 of 1
January 1st, 1970